Kessler Cascade

In development

Kessler Cascade

Everything in Earth orbit from the real catalog: the live sky, real breakups, your own collisions, and a 200-year debris cascade.

Strike a satellite and watch the cloud wrap the planet. Replay the breakups that crowded orbit. Then try to keep low Earth orbit usable for a hundred years.

Open the simulation See my other projects

Free, in the browser. Best in desktop Chrome or Edge.

The cascade game, mega-constellation run: debris building up around the planet.

In 1978 Donald Kessler warned that enough debris in orbit would make collisions feed on themselves. This page is a tour of an instrument that lets you test that idea on the real catalog, with the models, the sources and the misses all on screen.

01 The live sky

Every tracked object, where it really is

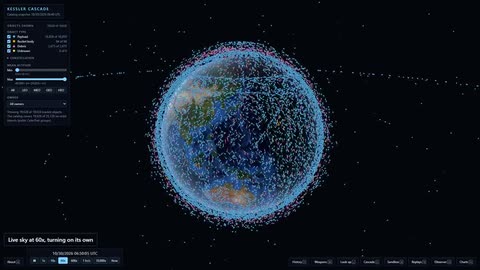
The public build draws 19,628 objects from CelesTrak's catalog and moves them with the standard SGP4 orbit model in a pool of background workers. Run time from 1x to 10,000x, switch trails on to see each orbit as a streak, then pick any dot for its card and ground track.

Data: CelesTrak orbital elements and SATCAT snapshots, committed with the app and never fetched when the page loads.

02 Real breakups

Replay the events that crowded orbit

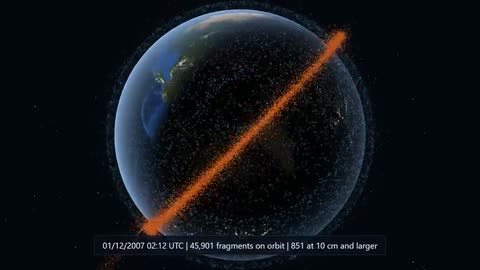
Three real events, rebuilt with the NASA Standard Breakup Model and then flown forward with gravity and air drag: the 2007 Chinese test on FY-1C, the 2009 Iridium 33 and Cosmos 2251 collision, and the 2021 Cosmos 1408 test.

An honest miss, on screen. The published model makes fewer pieces than the catalog shows: for FY-1C it gives about 900 pieces of 10 cm and up against 3,531 cataloged, a shortfall NASA itself reported. A "scaled to the catalog" mode sits beside it and is labeled as scaled.

Data: Johnson et al. (NASA Standard Breakup Model, 2001); published catalog counts for the comparison.

03 The sandbox

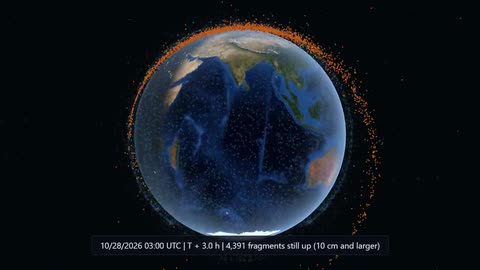
Strike Envisat and watch the cloud wrap the planet

Collide any two objects, or strike one. A weapon test on the big dead Envisat satellite at 764 km and 9.00 km/s makes about 4,400 pieces of 10 cm and up, and the sandbox shows them streaking out and spreading around the whole planet over months.

It also counts what the cloud does to the neighbors, using Liou's cube method. A bug found a day later in that count was fixed and reported: the one-year rise in collisions in the shell went from +834 percent to a corrected +126 percent.

Method: NASA Standard Breakup Model for the fragments; Liou's cube method (2003) for collision rates.

04 The cascade game

Keep low Earth orbit usable for 200 years

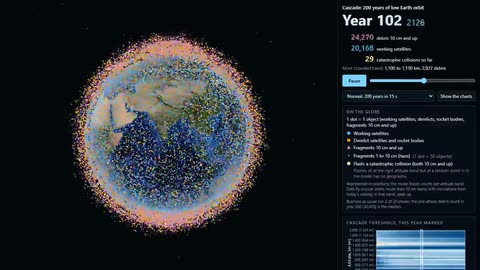
A model of low Earth orbit in 36 altitude bands, stepped monthly, with launches, disposal, explosions and collisions. You pull the levers: launch rate, disposal compliance, removals per year, mega-constellations.

On business as usual, debris of 10 cm and up grows from 12,640 to 36,704 in 200 years. With no new launches, this model's debris falls instead, which disagrees with ESA, LEGEND and IADC. The screen says so rather than hiding it.

Data: ESA Space Environment Report 2026 and the studies it cites, shown next to the results.

05 Look up from your location

The sky above you, satellites included

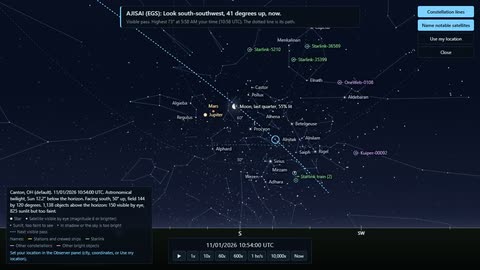
Enter where you are and the page shows a first-person sky: 8,920 stars with constellation lines, the Sun, the Moon with its phase, the planets, and every satellite where it really is. It tells you where to look for the next visible pass.

Notable satellites are named, but only ones you could actually see by eye, at most 12 at a time: the space stations, Hubble, Starlink with whole trains grouped, OneWeb and Kuiper. Tap any dot to see what it is.

Positions were checked against Skyfield to within 0.006 degrees, and it holds 80 to 161 frames per second with the full catalog. Your location stays in your own browser.

Data: HYG Database v4.2, Stellarium constellation lines (both CC BY-SA 4.0), astronomy-engine.

06 Space weapons, what if

Four scenarios from public sources

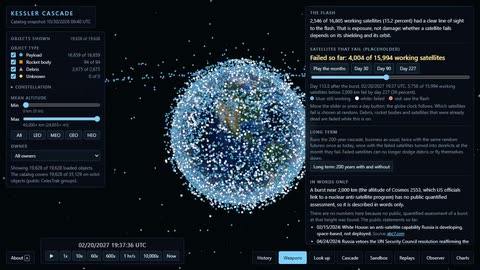
A chaser satellite phases up to a target, loops around it, then strikes. A slow hit damages it and makes 4 pieces; a 9 km/s hit on the same satellite makes about 1,500. Starfish Prime, the 1962 test, is placed on today's sky: 2,546 of 16,805 working satellites could see the flash.

Illustrative, and labeled that way. Which satellites fail is a placeholder drawn from the 1962 outcome, not a radiation model, and the screen says so. The model also clears low-altitude strike debris faster than the real record. Nothing here describes how a weapon is built.

Data: public sources cited per scenario on screen (Burnt Frost, Mission Shakti, Starfish Prime, the 2024 and 2025 statements).

07 History

The catalog, from 1957 to today

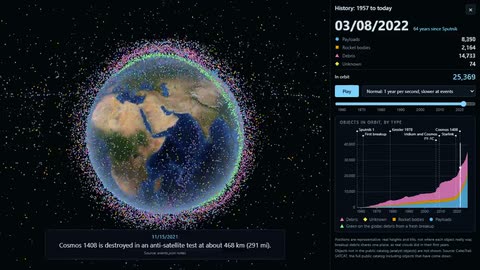
Every object in CelesTrak's full public catalog, 70,770 in all including 35,641 that have come down, appears when it was cataloged and disappears when it fell. The clock runs about a year per second and slows at each marked event, with a stacked chart and sourced captions.

Counts match the official catalog: 35,129 objects in orbit today. Debris dates come from catalog numbers and reproduce NASA's published FY-1C cataloging counts exactly.

Data: CelesTrak SATCAT; event captions from the sources listed in the app's About panel.

How it was made

Eleven checkpoints in two days, from the first globe on 10/28/2026 to the History screen on 10/29. Each one was judged by an independent reviewer that saw only the criteria and the evidence, and the misses were kept on screen instead of tuned away.

  1. The globe and the real catalog. A polite fetch tool, a gap report by NORAD number, and three.js on WebGPU with a WebGL2 fallback.
  2. Live orbits. The first state pump managed about 70 updates a second and was rebuilt as a two-state pipeline with a test.
  3. Observer mode, then breakups. Pass predictions checked against Skyfield; then the breakup model, which undercounted fragments and was reported that way.
  4. The sandbox and the cascade. A precision bug in the collision-rate count was found a day after the checkpoint and corrected, with a regression test.
  5. Make it move, Look up, weapons, history. Trails and strikes on the globe, a first-person sky, four public-source scenarios, and the catalog from 1957. Low-altitude strike debris clearing too fast is still listed as a known miss.
The live sky with trails
The live sky
FY-1C breakup replay
FY-1C replayed
Envisat strike frame
The Envisat strike
The 200-year cascade at year 102
The 200-year cascade
Look up with named satellites
Look up, satellites named
Starfish Prime with failed satellites in white
Failures drawn in white
History screen
The History screen

Designed and directed by Stewart Gregerson. Built with Claude Opus 5.5 in Claude Code, with worker agents for implementation and a fresh reviewer agent at every checkpoint. Static ES modules, no bundler: three.js r186 (WebGPU, WebGL2 fallback), satellite.js 7.1.0, Web Workers, Node for tests and tools, Playwright for the captures. Every clip on this page was filmed by script from the public build, the same data visitors get.

Data and credits

Pick an object and see what happens next.

Open the simulation See my other projects